Exploring Connections Between Regional Economic Indicators and Participation Rates in Daily Fantasy Sports Contests
Theo Wagner · Jul 14, 2026
Exploring Connections Between Regional Economic Indicators and Participation Rates in Daily Fantasy Sports Contests
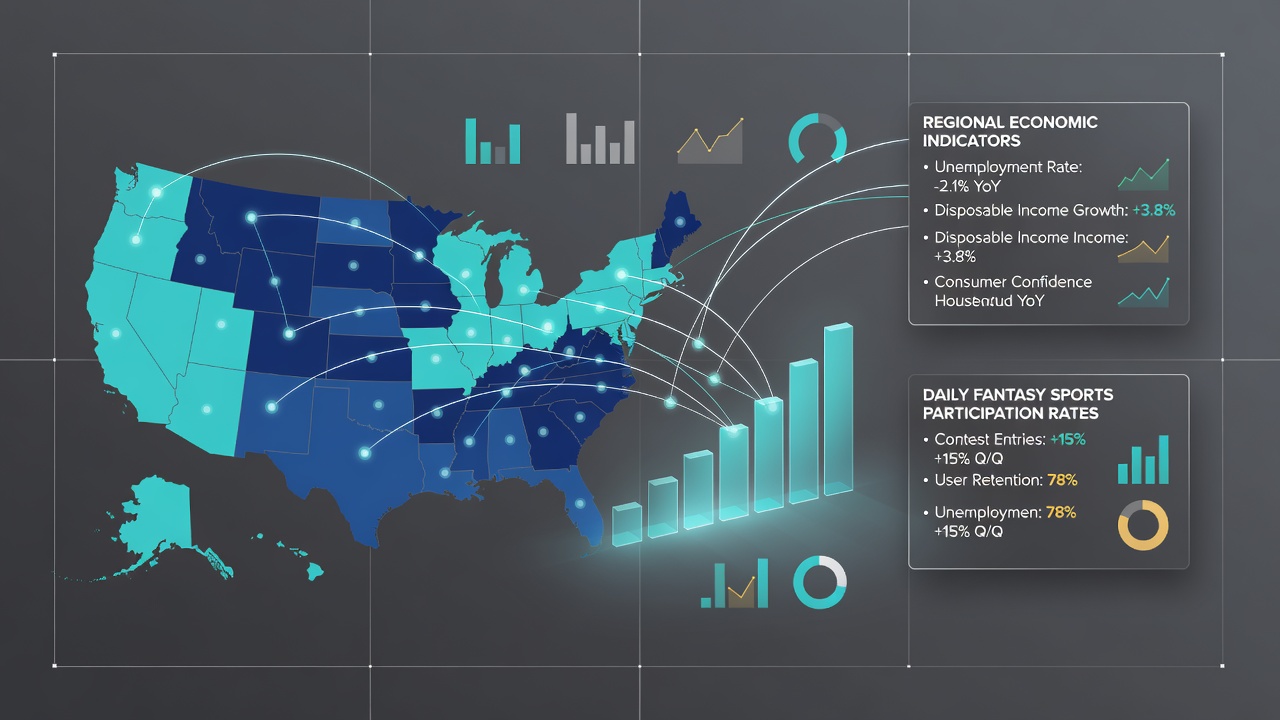
Daily fantasy sports contests have drawn sustained attention from researchers who track how local economic conditions shape player engagement, and data released through early 2026 continues to highlight measurable links between indicators such as unemployment rates, median household income, and consumer spending patterns and the volume of contest entries across different jurisdictions. Observers note that states and provinces experiencing steadier job markets often record higher average entry volumes during the same periods when broader retail spending remains elevated, while areas with rising unemployment see slower growth in contest participation even when prize pools stay consistent.
Economic Indicators That Correlate With Entry Volumes
Analyses conducted by university research teams and government statistical agencies have examined quarterly data sets that pair labor market statistics with anonymized entry logs from major daily fantasy platforms, revealing that median income levels above the national average frequently coincide with increased contest activity in metropolitan regions. In contrast, counties where unemployment climbed above 6 percent during 2025 showed participation growth rates that lagged behind national figures by 12 to 18 percent, according to aggregated platform reports. Consumer confidence indices published by the Conference Board also align closely with entry spikes, particularly in months when wage growth outpaces inflation in specific states.
What's interesting is how these patterns hold across different contest formats, whether salary-cap basketball challenges or season-long football pools, because players appear to adjust their spending in response to local payroll data rather than national trends alone. Researchers at several institutions have cross-referenced these figures with credit card transaction volumes tied to entertainment categories, finding that regions where discretionary outlays remained above pre-pandemic baselines sustained steadier entry rates through the first half of 2026.
Regional Variations Observed in Mid-2026 Data
July 2026 figures from state gaming commissions and provincial regulators illustrate noticeable differences between high-income coastal markets and inland areas still recovering from manufacturing slowdowns. In states where average weekly earnings rose more than 4 percent year-over-year, daily fantasy operators reported entry increases ranging from 7 to 11 percent compared with the same period in 2025. Meanwhile, jurisdictions that posted flat or declining labor force participation recorded entry volumes that either plateaued or dipped slightly, even as promotional bonuses remained available to new and returning users.
One study released by a Canadian research consortium compared participation across three provinces and found that regions with stronger resource-sector employment posted higher per-capita contest activity than provinces where service-sector wages stagnated. Similar comparisons drawn from U.S. Bureau of Labor Statistics county-level data show that metro areas with lower housing-cost burdens relative to income maintained more consistent player bases throughout teh spring and early summer months.
Platform Features and Local Economic Context
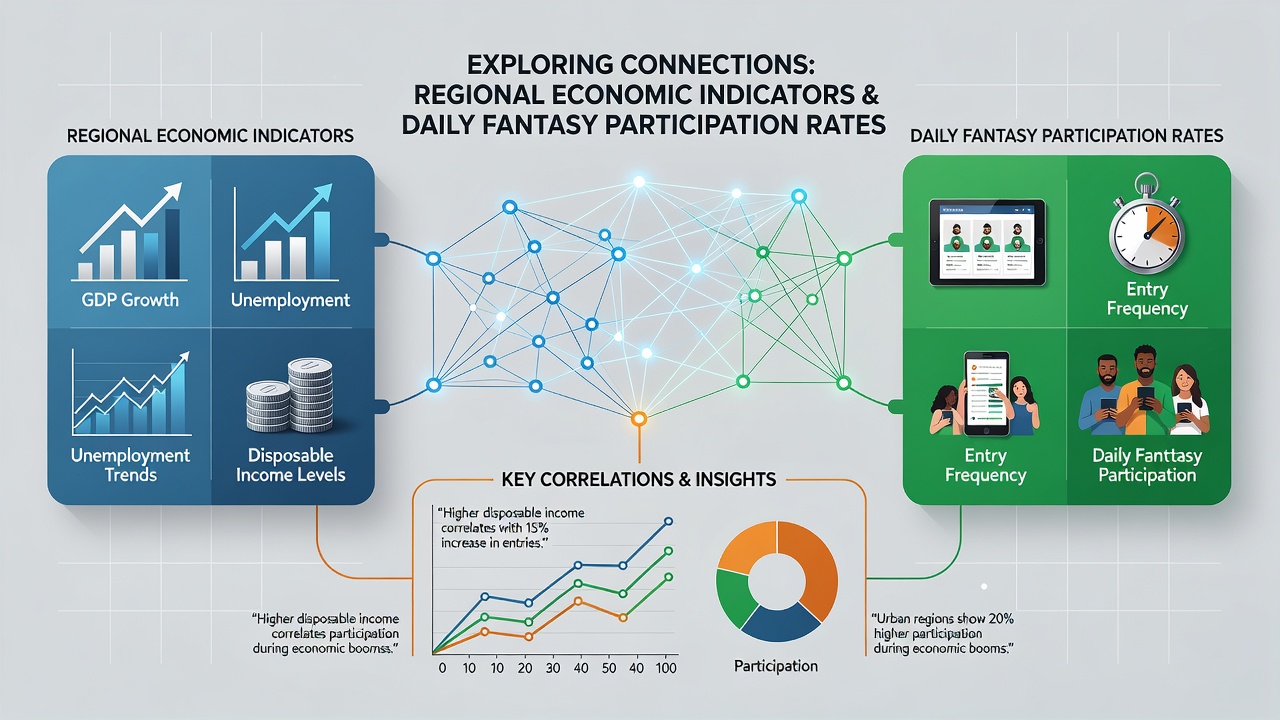
Operators have adjusted contest structures in response to these regional patterns, introducing lower-stakes formats in markets where economic indicators signal tighter household budgets. Data shared with academic partners indicates that contests priced under $5 maintain steadier participation in counties where unemployment exceeds state averages, whereas higher-stakes events concentrate in areas where wage growth and retail sales both trend upward. Mobile app metrics further reveal that users in economically stable regions log in more frequently during weekday evenings, while activity in slower-growth areas clusters around weekends when promotional free entries become available.
Academic papers examining player migration between states after tax policy changes have noted that daily fantasy participation can shift when withholding rules on winnings change, yet these movements remain smaller than those observed in traditional sports betting markets. Researchers continue to monitor whether upcoming regulatory updates scheduled for later in 2026 will produce comparable effects on entry volumes in states that recently revised their tax treatment of contest prizes.
Future Monitoring and Data Collection Efforts
Government agencies and industry trade groups have begun coordinating data-sharing agreements that will allow more granular tracking of how shifts in regional GDP components, particularly personal consumption expenditures, align with contest participation trends through the remainder of 2026. Early results from pilot programs in two states suggest that real-time economic dashboards can help operators anticipate entry fluctuations weeks in advance, enabling more targeted bonus structures that match local spending capacity. Continued collection of anonymized player data alongside official labor statistics should clarify whether these correlations strengthen or weaken as broader economic conditions evolve.
Conclusion
Available evidence demonstrates clear associations between regional economic indicators and daily fantasy sports participation rates, with income levels, employment figures, and consumer spending patterns serving as reliable predictors of entry volume across multiple jurisdictions. As new data sets emerge in the second half of 2026, researchers and regulators will gain additional clarity on how these relationships develop under varying policy environments, providing operators and policymakers with more precise tools for understanding player behavior in this segment of the gaming industry.